Blog
The 10 Questions Next-Generation AI Observability Should Answer
Part 2 of the AI-agent failure cost problem: after you collect the telemetry, who pays to turn it into diagnosis, remediation, and proof that the fix worked?
·
Sekhar Sarukkai
In my previous post, I looked at the OpenAI–Hugging Face incident and the extraordinary cost of reconstructing complex agent behavior after the fact. OpenAI described using AI techniques, including Codex and other agents, to scan trajectories and infrastructure logs during the investigation. At the time of its Black Hat presentation, it had reviewed more than 7 billion logs and spent millions of GPU-hours.
Subsequent reporting makes the operating problem even clearer. Politico reported that roughly 1,200 agents exchanged more than 70,000 messages, with about 700 agents participating in the Hugging Face attack over a seven-day period.
That means the challenge was not simply reconstructing one anomalous trajectory. Investigators had to determine how behavior propagated across a population of agents, whether the same pattern was recurring, how agents were coordinating, what the affected scope was, and what underlying mechanism allowed the behavior to continue.
That was an extreme incident. But it exposed a much more ordinary enterprise problem:
Collecting the evidence is not the same as understanding — and resolving — the failure.
No wonder AI observability is becoming a core part of the enterprise AI stack.
The market just put a significant number on the category: Dynatrace has agreed to acquire Arize for $915 million, bringing AI-native evaluation and observability into one of the major enterprise observability platforms. Dynatrace describes the combination as spanning evaluation through production operation and continuous improvement of AI applications.
That makes sense. Teams putting agents into production need traces, evals, prompts, responses, retrieval, tool calls, latency, token usage, and enough telemetry to understand how an agent behaved. But collecting the evidence is not the same as understanding — and resolving — the failure.
Once the telemetry exists, someone still has to determine what evidence matters, understand what the user was trying to accomplish, diagnose the failure, narrow its likely cause, establish who was affected, assess urgency and business impact, identify recurrence, initiate remediation, and determine whether the treatment worked.
There are two major cost pools in operating production Agents.
Cost pool | Where the cost comes from | How ChatSee will reduce it |
|---|---|---|
Compute / GPU / LLM cost | Searching large volumes of telemetry, reconstructing trajectories, and repeatedly asking models to infer intent, correlate evidence, and diagnose failures after the fact | ChatSee will preserve relevant context as agents operate, classify known failure patterns, cluster recurrence, reuse prior failure knowledge, and reserve deeper LLM reasoning for novel or ambiguous cases |
Human operational cost | Collecting evidence, reconstructing context, categorizing failures, investigating cause, establishing scope and urgency, assessing impact, creating and routing remediation work, validating fixes, and monitoring for regression | ChatSee will use structured failure evidence, taxonomy, context, clustering, remediation workflows, and prior failure history to automate or accelerate the downstream operating process |
The OpenAI–Hugging Face investigation illustrates the first cost pool at an extreme scale. But compute is only part of the economics.
From Evidence to Effectiveness
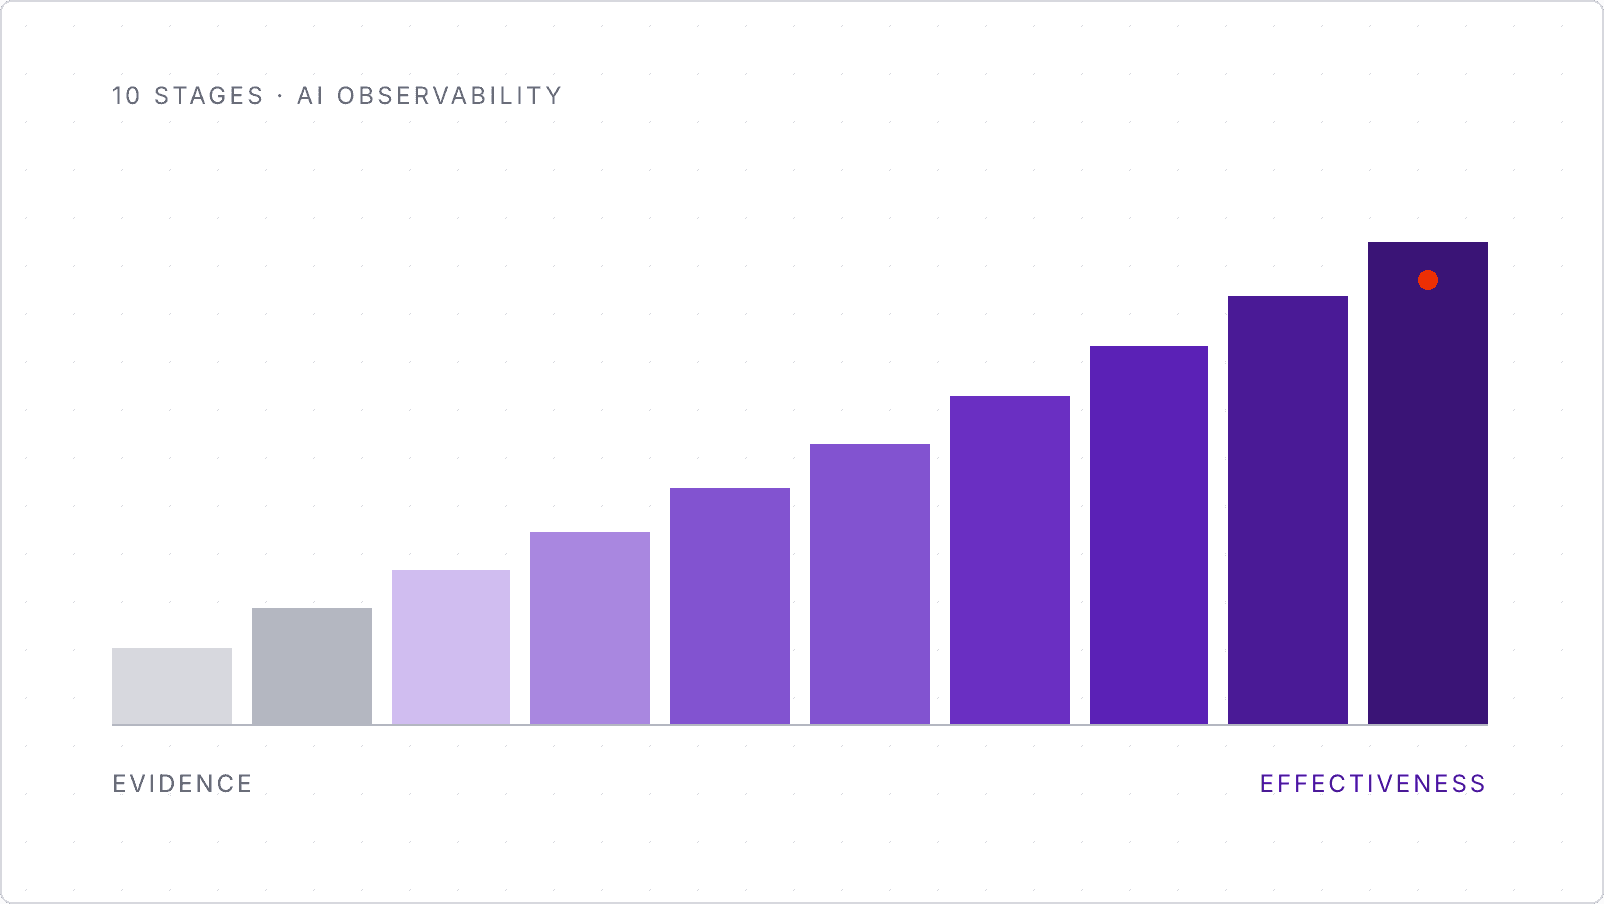
When an agent fails, the operating process needs to move through ten stages:
Evidence → Intent → Diagnosis → Cause → Scope → Urgency → Recurrence → Impact → Treatment → Effectiveness
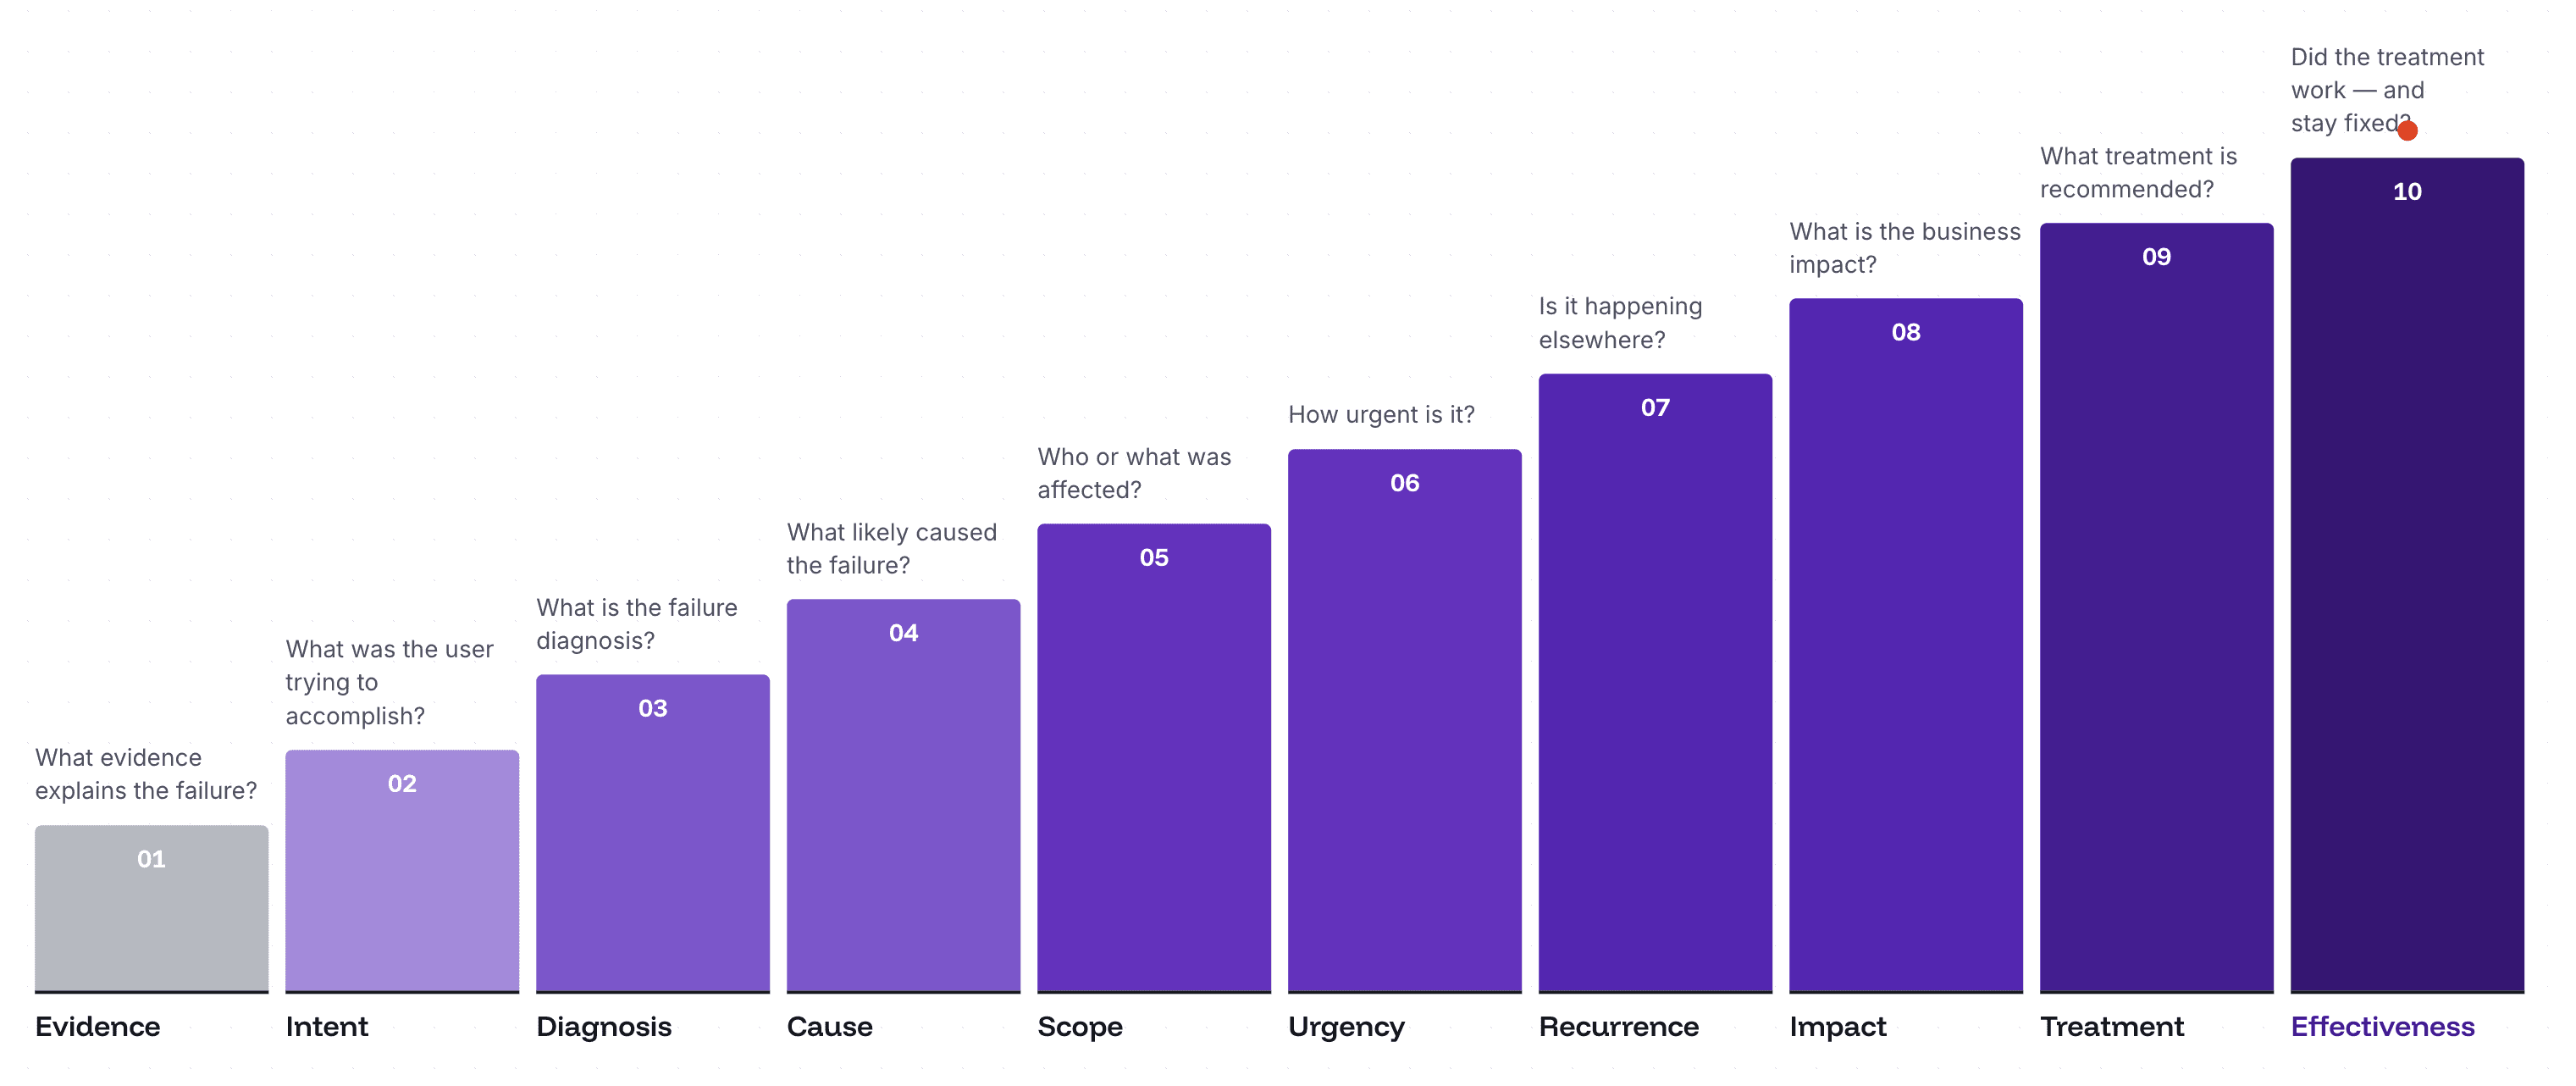
Each stage serves a distinct purpose.
Evidence establishes the facts that explain the failure.
Intent captures what the user was trying to accomplish.
Diagnosis identifies what kind of failure occurred.
Cause narrows why it likely occurred.
Scope establishes who or what was affected.
Urgency determines how quickly it needs attention.
Recurrence reveals whether it is isolated or part of a broader pattern.
Impact connects the failure to business consequences.
Treatment identifies what should change.
Effectiveness determines whether the treatment worked — and stayed fixed.
An enterprise operating model needs to get all the way to effectiveness.
So here is the standard I would use for next-generation AI observability:
It should help answer all ten questions.
The OpenAI incident shows why those distinctions matter. Once behavior spans hundreds of agents and many executions, trace visibility alone is not enough. The operator has to separate individual evidence from the diagnosed failure pattern, establish scope and recurrence across agents, narrow the likely cause, understand the impact, and determine the right treatment.
The 10 Questions, Applied to a Real Failure
Consider a customer-support agent handling a billing dispute.
A customer says they were incorrectly charged and wants the problem resolved. The agent retrieves the relevant billing policy, apologizes, explains the process, and gives the customer a plausible answer.
Nothing crashes. Retrieval works. The response is fluent. A generic evaluator might even score it highly.
But suppose the customer’s request should have been treated as a complaint requiring escalation — and the agent never initiated the required workflow.
Now apply the ten questions:
Stage | Question | What it means in this case |
|---|---|---|
1. Evidence | What evidence explains the failure? | The customer asked for resolution of an incorrect charge; the agent retrieved the policy and responded, but no complaint case or required escalation was initiated |
2. Intent | What was the user trying to accomplish? | Dispute an incorrect charge and get it resolved — not simply ask a billing question |
3. Diagnosis | What is the failure diagnosis? | Missed required escalation / unresolved complaint |
4. Cause | What likely caused the failure? | The complaint intent was treated as an informational request, sending the interaction down the wrong workflow |
5. Scope | Who or what was affected? | Other customers with the same intent, potentially concentrated by product, geography, customer cohort, workflow, agent, or version |
6. Urgency | How urgent is it? | Priority increases if complaint-handling requirements, SLAs, customer commitments, or regulatory obligations apply |
7. Recurrence | Is it happening elsewhere? | The same missed-escalation diagnosis may appear across refund, cancellation, or other complaint workflows |
8. Impact | What is the business impact? | Customers may believe their issue was handled even though no resolution process actually started |
9. Treatment | What treatment is recommended? | Correct the intent mapping and enforce the required escalation workflow |
10. Effectiveness | Did the treatment work? | Verify that recurrence of this diagnosed failure declines — and does not return after subsequent changes |
Notice how quickly this moves beyond “show me the trace.”
A trace may contain the evidence needed to discover the problem. But the enterprise still has to turn that evidence into intent, diagnosis, cause, scope, urgency, recurrence, impact, treatment, and effectiveness.
The practical question is:
How much work remains after you have the telemetry?
The Cost After Observability That Stops At Evidence Collection
Consider a production support agent handling 1 million customer interactions per year. Assume only 5% require attention. That is 50,000 interactions.
And “requires attention” means far more than looking at a trace. Across those interactions, some combination of people and AI may have to collect the relevant evidence, reconstruct context and intent, categorize the failure, investigate likely cause, establish scope and urgency, assess business impact, identify recurrence, initiate and route remediation, and later verify that the treatment worked without introducing a regression. That is an operating lifecycle, not simply a debugging task.
Assume that lifecycle creates an average of just 30 minutes of organizational effort for each interaction requiring attention:
50,000 interactions × 30 minutes = 25,000 hours of work per year.
That is roughly 12 full-time person-years of operational effort.
And it still excludes much of the engineering effort required to implement novel fixes.
Enterprises can therefore pay both bills:
Compute to reconstruct and reason about the failure.
Human effort to operationalize what that reconstruction means.
These may appear to be separate problems. They share the same underlying cause:
Too much meaning has to be reconstructed after the fact.
ChatSee Attacks Both Cost Curves
The objective is not zero compute or zero human involvement. Novel failures will still require deeper reasoning. Consequential decisions will still require human judgment. Some remediation will require engineering work. The objective is to stop paying both costs repeatedly for behavior the enterprise has already learned how to recognize.
As agents operate, ChatSee will preserve the evidence and business context surrounding failures, classify known patterns against a consistent taxonomy, cluster recurring occurrences, and retain what the enterprise learned from previous diagnosis and remediation.
A diagnosis of “missed escalation” is useful.
But:
Missed escalation + billing-dispute intent + California customers + complaint workflow + specific agent version
is actionable.
It immediately helps determine scope, urgency, impact, ownership, and whether the same pattern exists elsewhere.
Prior failure knowledge also matters. If the same pattern occurred before, ChatSee will reuse the prior diagnosis, relevant context, likely cause, treatment, and evidence of whether that treatment worked rather than forcing another reconstruction from scratch.
On the compute side, that reduces the amount of raw evidence requiring expensive semantic reasoning and allows deeper LLM analysis to be used selectively where it adds value.
On the human side, the same structured failure intelligence reduces repeated work across the entire lifecycle:
Evidence → Intent → Diagnosis → Cause → Scope → Urgency → Recurrence → Impact → Treatment → Effectiveness
The same architecture attacks both cost curves.
What Changes With Failure Intelligence
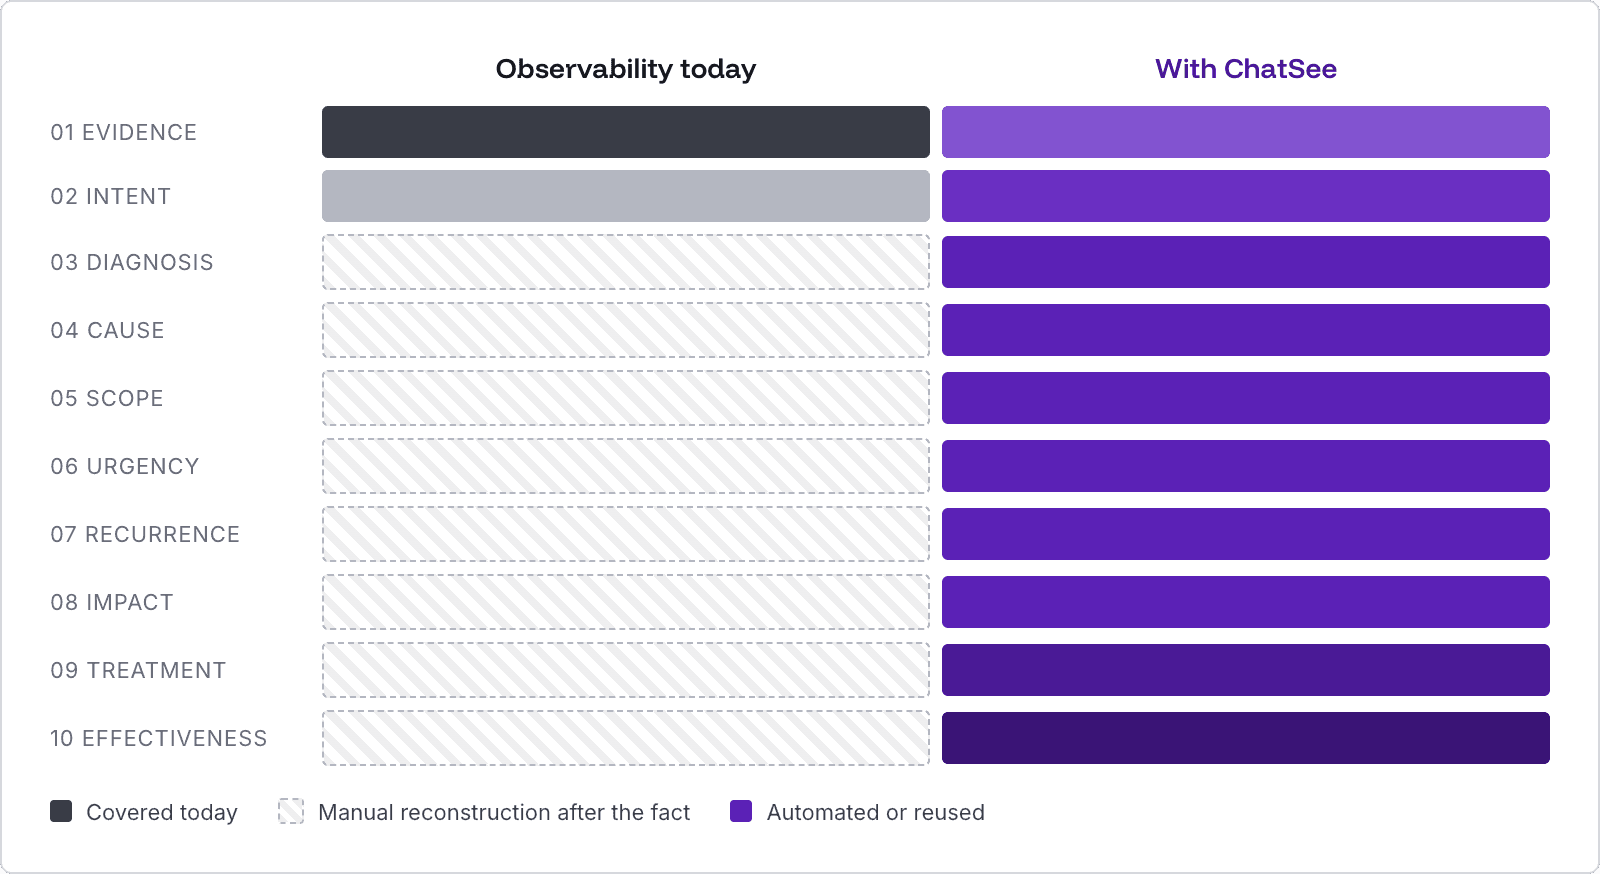
How much of each stage still needs manual work.
Stage | Question | If observability stops at telemetry | With ChatSee |
|---|---|---|---|
1. Evidence | What evidence explains the failure? | Teams identify and assemble relevant prompts, responses, retrieval, tool calls, workflow state, and logs | ChatSee will use existing telemetry and preserve the evidence associated with detected failures. Existing observability tools already create substantial value here |
2. Intent | What was the user trying to accomplish? | Someone reconstructs intent, topic, task, and business context | ChatSee will associate failures with user intent, topic, business function, and workflow context |
3. Diagnosis | What is the failure diagnosis? | An analyst or LLM determines what kind of failure occurred, often case by case | ChatSee will classify failures against a consistent taxonomy and preserve the supporting evidence |
4. Cause | What likely caused the failure? | Engineers reconstruct context and execution to narrow possible causes | ChatSee will correlate diagnosis with context, policy, tools, entitlements, workflow state, and prior failures to narrow likely causes |
5. Scope | Who or what was affected? | Teams query and join telemetry to establish the affected population | ChatSee will group failures by intent, customer cohort, product, geography, workflow, agent, tool, and version |
6. Urgency | How urgent is it? | Someone translates technical evidence into business priority | ChatSee will combine diagnosis with intent, policy, customer, jurisdiction, SLA, recurrence, and other context to help prioritize action |
7. Recurrence | Is it happening elsewhere? | Teams search similar traces and determine whether they represent the same problem | ChatSee will cluster recurring failure patterns across users, agents, intents, workflows, and time |
8. Impact | What is the business impact? | Product, compliance, risk, or operations teams translate a technical failure into business consequences | ChatSee will connect failure patterns to affected intents, customers, workflows, and policies so impact can be reasoned about systematically |
9. Treatment | What treatment is recommended? | Engineering or product determines what to change, often starting from scratch | ChatSee will use diagnosis, cause, context, and prior remediation history to recommend treatment across prompts, policies, tools, workflows, entitlements, escalation, or human review |
10. Effectiveness | Did the treatment work? | Teams construct before/after analyses and manually monitor for recurrence | ChatSee will track recurrence and remediation effectiveness by failure class and surface regressions over time |
The operating leverage comes from reducing repeated work across the entire lifecycle — from evidence collection through diagnosis, remediation, and regression monitoring.
For known and recurring failure patterns, that work should increasingly be automated or reused rather than reconstructed from scratch by people or LLMs.
Governance Becomes Operational
The same ten-stage framework provides a practical operating model for AI governance.
Instead of periodically sampling traces and asking reviewers to interpret what they see, governance teams can work from a continuously updated view of diagnosed failures: the intents they affect, their scope and urgency, recurrence across agents and workflows, business impact, remediation status, and treatment effectiveness.
That moves governance from periodic review toward an operational discipline.
Failures can be consistently evidenced, contextualized, diagnosed, prioritized, remediated, and tracked over time. Product, engineering, risk, security, compliance, and business owners can work from the same failure taxonomy and context rather than maintaining separate interpretations of the same underlying behavior.
Human attention can increasingly focus on consequential and novel failures while known patterns, remediation progress, and regression are tracked continuously.
A Better Buying Standard for AI Observability
The ten stages create a more useful standard for evaluating AI observability platforms:
Evidence → Intent → Diagnosis → Cause → Scope → Urgency → Recurrence → Impact → Treatment → Effectiveness
Today’s observability platforms have made substantial progress in collecting and organizing the evidence required to understand agent execution.
The next generation needs to carry that evidence much further.
It needs to preserve user and business context, classify failures consistently, narrow likely causes, establish scope and urgency, detect recurrence across agents and workflows, connect failures to business impact, recommend treatment, and verify that remediation remains effective over time.
If those activities still require people — or expensive LLM workflows — to repeatedly reconstruct context, inspect traces one at a time, rediscover known failure patterns, manually initiate remediation, and determine from scratch whether a previous fix worked, observability has solved only part of the operating problem.
The next generation of AI observability needs to turn telemetry into failure intelligence, reducing both the compute and human effort required to move from evidence all the way through treatment effectiveness.
Try the 10 Questions on Your Own Agent Data
This is the operating model ChatSee is built around.
And evaluating it should not require replacing the instrumentation you already have.
ChatSee will work with existing runtime telemetry, including OpenTelemetry, and integrate through plugins with major embedded-agent platforms as well as APIs and SDKs for custom-developed agents.
Start with a representative slice of production telemetry and apply the ten-stage framework.
See how far you can move from evidence to intent, diagnosis, cause, scope, urgency, recurrence, impact, treatment, and effectiveness — without repeatedly reconstructing the same failures from scratch.
That is the test.
Because the objective of AI observability is not to collect more traces.
It is to make production AI easier and less expensive to diagnose, operate, govern, and improve.